Pearson correlation coefficient and Spearman's rank correlation coefficient


Table of contents
Hey everyone, hope you are doing great. In the previous article, we understood correlation and covariance. Cov(x,y) helps us to identify the relationship between x and y i.e. if the value of Cov(x,y) is +ve, this means the value of x increases when the value of y increases and vice versa. Whereas if the Cov(x,y) is -ve the value of x decreases when the value of y increases and vice versa.
Pearson Correlation
Though we can find the direction of the relationship i.e. in the same direction(+) or opposite (-) we cannot find the strength of the relationship i.e. we cannot measure how -ve or +ve it is. Now, this is where the Pearson correlation comes in. Pearson correlation can help us tell how strongly the two variables are correlated apart from seeing the direction of the relationship.

In Pearson correlation the value ranges [-1, 1]. -1 being the least correlated and 1 being the most.
Note-: If the Pearson correlation turns out to be 1 this means that both the variables are same. This means that one variable can be dropped from the table to make the data suitable for applying machine learning algorithm. This is called feature selection which we will talk about in upcoming articles.
Spearman Correlation
Spearman correlation, also known as Spearman's rank correlation coefficient, is a measure of the strength and direction of the association between two variables. Unlike Pearson correlation, which measures the linear relationship between two variables, Spearman correlation measures the monotonic relationship between two variables. A monotonic relationship is one in which the variables tend to move in the same direction but not necessarily at a constant rate.
Spearman correlation is calculated based on the ranks of the data, rather than the actual values. It is denoted by the symbol 'ρ'. The formula for the Spearman correlation coefficient is:
![]()
where:
n is the number of observations
d is the difference between the ranks of the two variables being studied
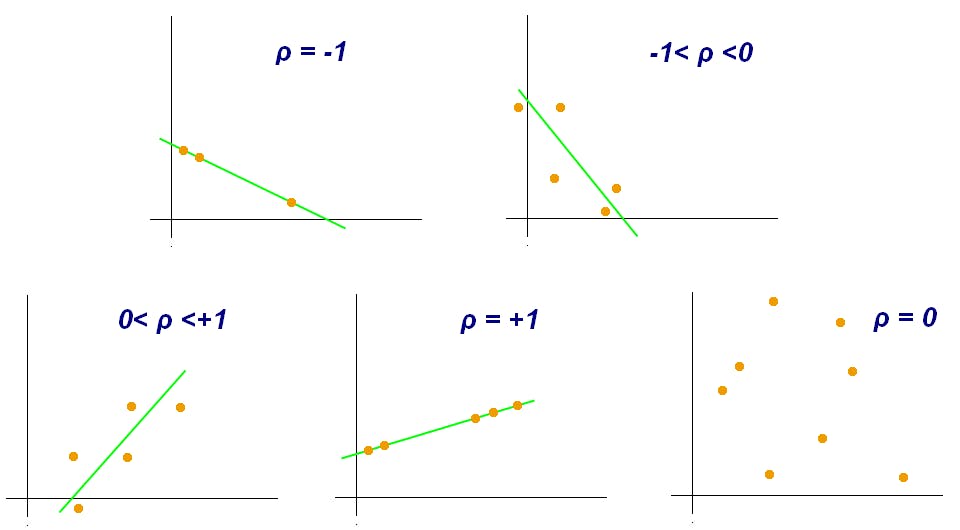
The Spearman correlation coefficient can range from -1 to 1, where -1 indicates a perfect negative monotonic relationship, 0 indicates no monotonic relationship, and 1 indicates a perfect positive monotonic relationship.
To better understand the calculation of Spearman correlation, let's consider an example. Suppose we have two variables X and Y with the following data:
X: 5, 7, 8, 2, 4 Y: 6, 8, 7, 3, 5
We need to calculate the rank for each value of X and Y. The rank is the position of the value in a sorted list. So, for X, we have:
X: 5, 7, 8, 2, 4 Rank: 3, 4, 5, 1, 2
And for Y, we have:
Y: 6, 8, 7, 3, 5 Rank: 3, 5, 4, 1, 2
Now we can calculate the differences between the ranks for each pair of observations:
X: 5, 7, 8, 2, 4 Rank: 3, 4, 5, 1, 2 Y: 6, 8, 7, 3, 5 Rank: 3, 5, 4, 1, 2 d: 0, -1, 1, 0, 0
Then we calculate the sum of the squared differences:
∑d^2 = 0^2 + (-1)^2 + 1^2 + 0^2 + 0^2 = 2
Plugging this into the Spearman correlation formula, we get:
ρ = 1 - (6(2) / 5(5^2 - 1)) = 1 - (12 / 124) = 0.903
So, in this example, the Spearman correlation coefficient is 0.903, indicating a strong positive monotonic relationship between X and Y.
This was all you need to know about Pearson and Spearman Correlation. Hope you got value out of it. Subscribe to the newsletter to get more such informative content.
Thanks :)